OverBoard
OverBoard
All your systems in cloud
OverBoard cloud software
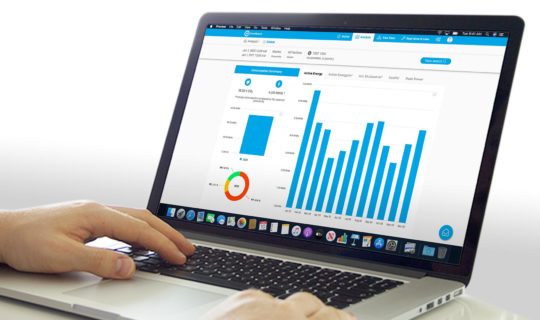
The easiest way to manage your plants. At anytime, anywhere.
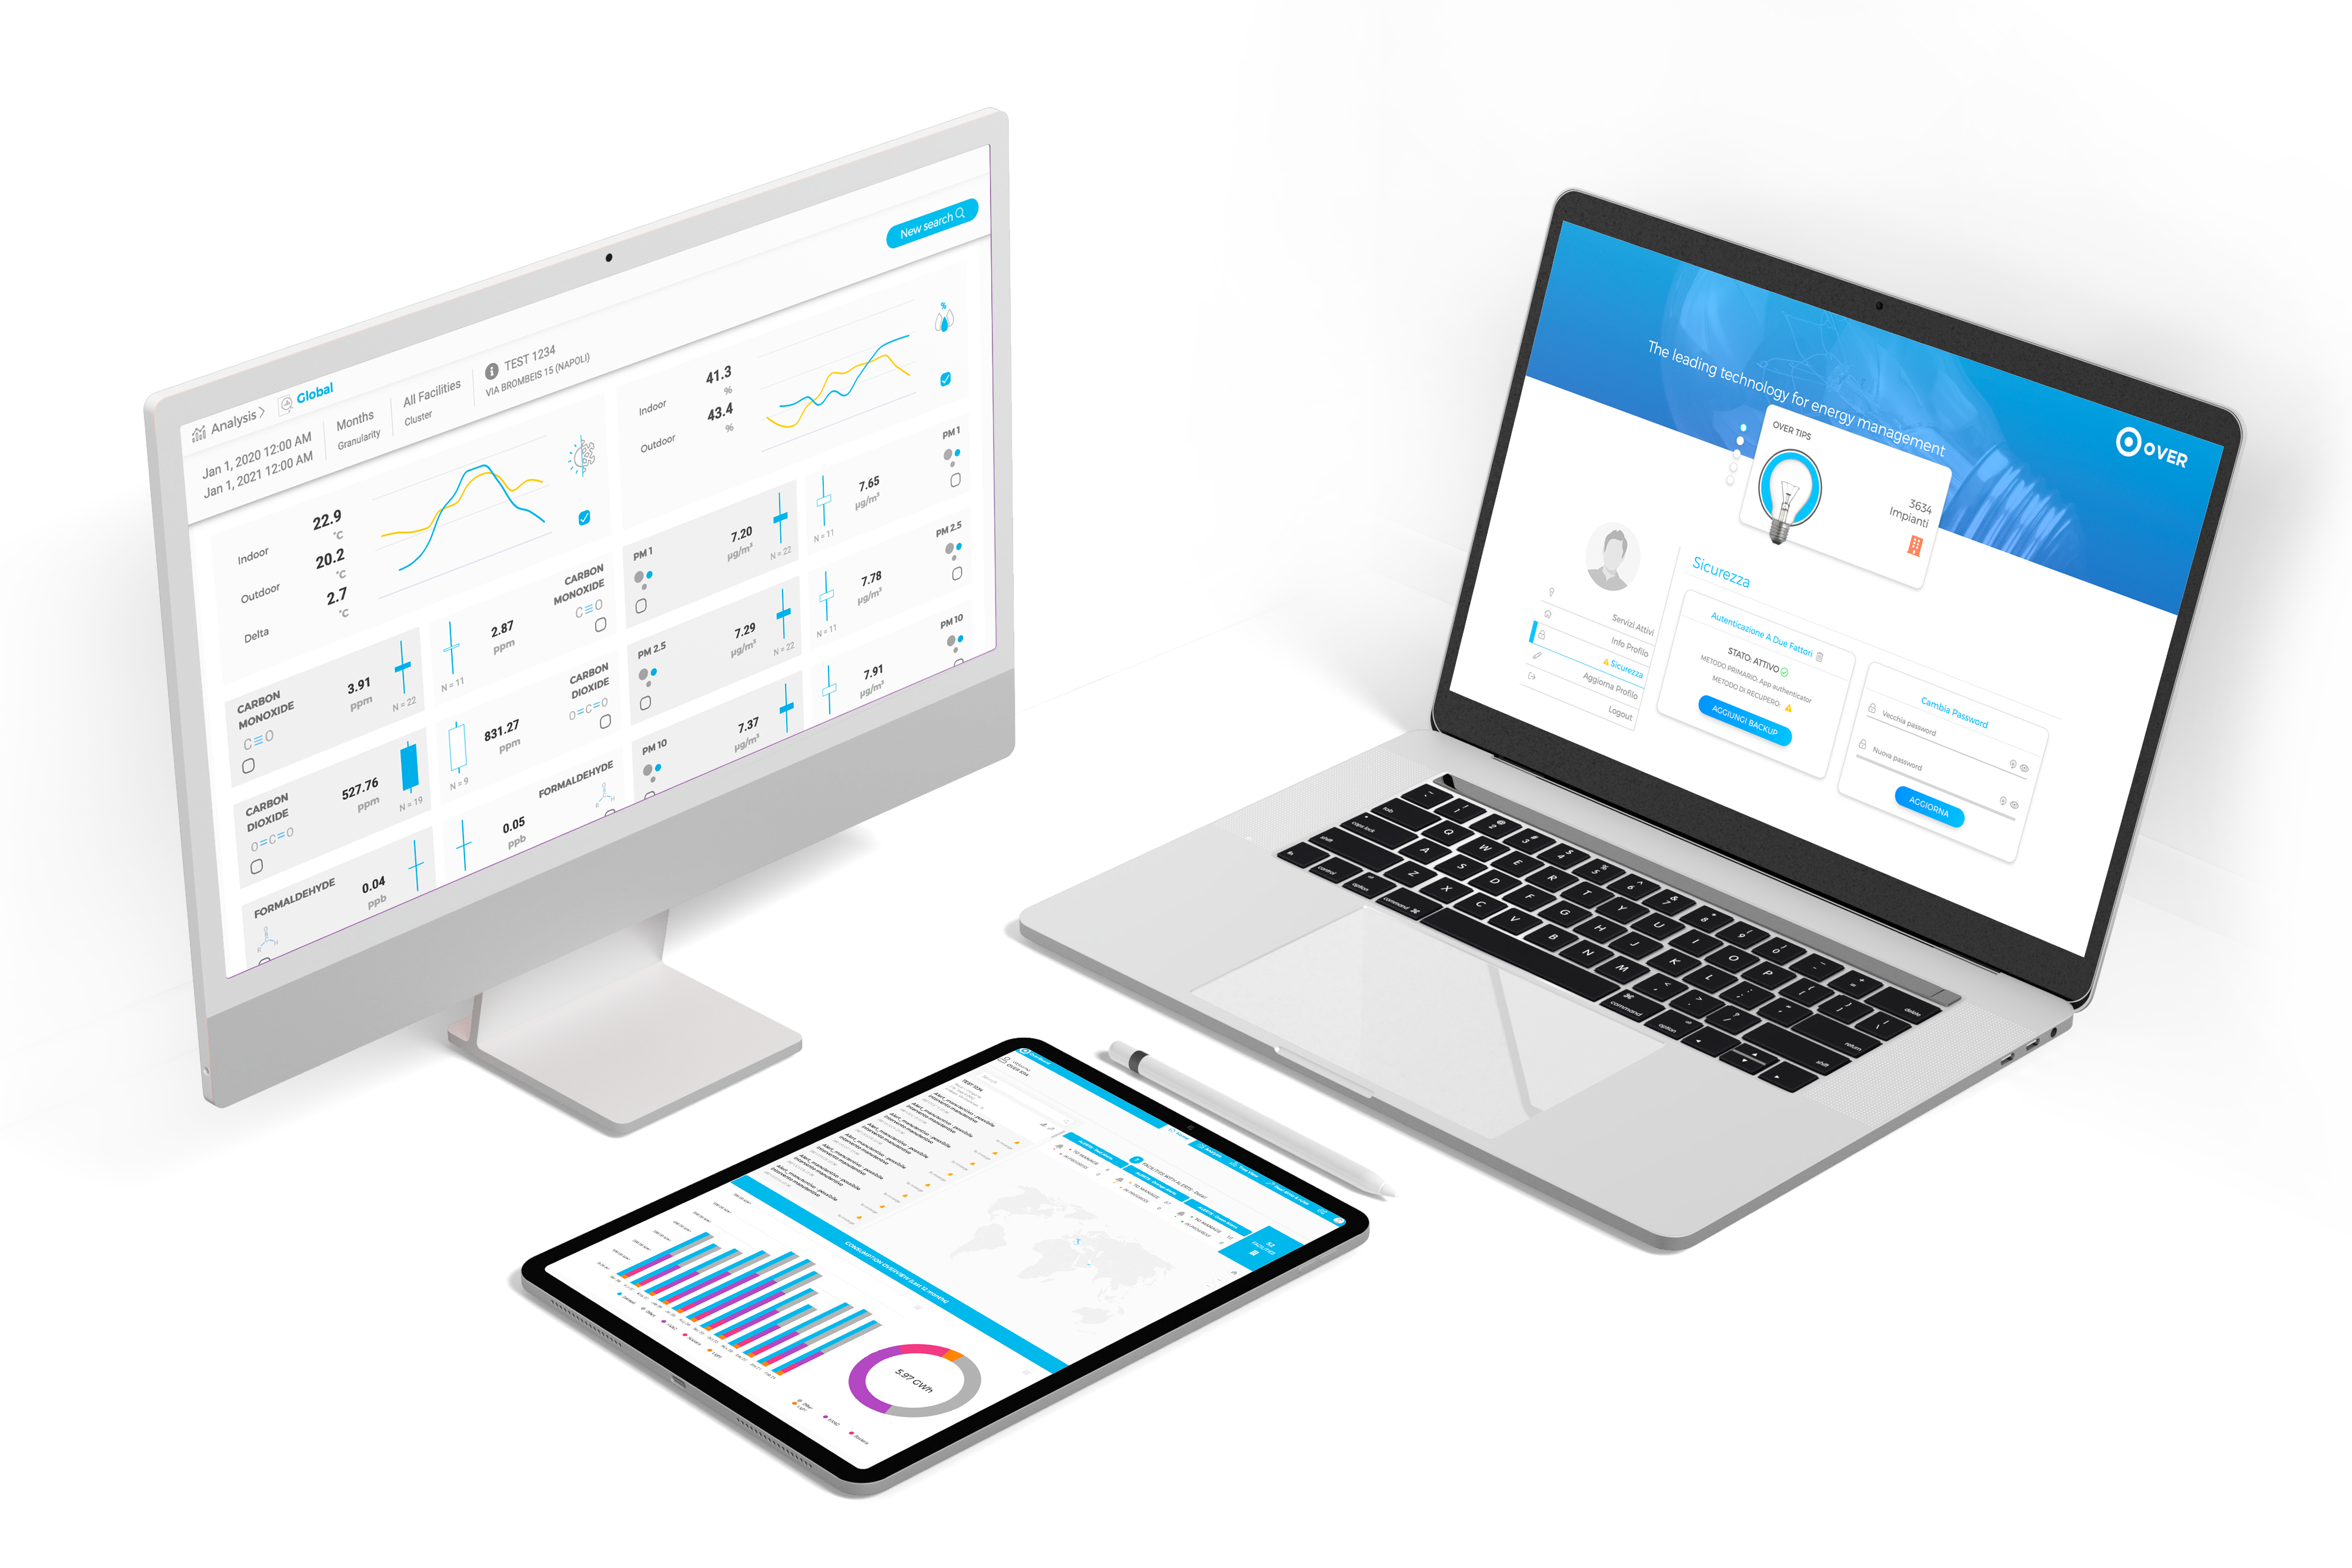
The OverBoard cloud software is developed and updated by our Research & Development Team to monitor, manage and optimize the energy consumption of associated plants. Every single upgrade comes from the deep knowledge and analysis of data by Over Innovators and their attunement to customers’ needs. Making our web platform for energy management distinct in the market since its very launch.
As a web service, OverBoard does not have any particular minimum system requirements; it does not require installation and it can be used by more than one user at a time, not needing any further training except an intuitive mind.

Sofware Overview

Main Features
OverBoard: a cloud based software developed by OVER, accessible through any web-browser. Our platform communicates with the OBox – our gateway – to request incoming data from the field of connected meters, actuators or sensors to offer end users data on a live and historical basis in easy to use and powerful graphics.
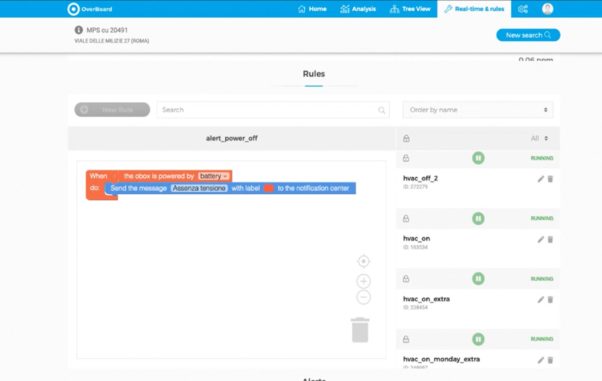
The Real-Time function of the Overboard enables the user to connect “live” to the devices installed in a given plant. A user can – in real-time – monitor consumption , create new e-rules or edit already existing ones. Once saved the e-rules immediately become active for dynamic actuation or alerts going forward. E-rules can be paused, deleted or created at any time or adjusted to account for external and constantly changing parameters (such as time, humidity, TVOCs, and others) at any time.

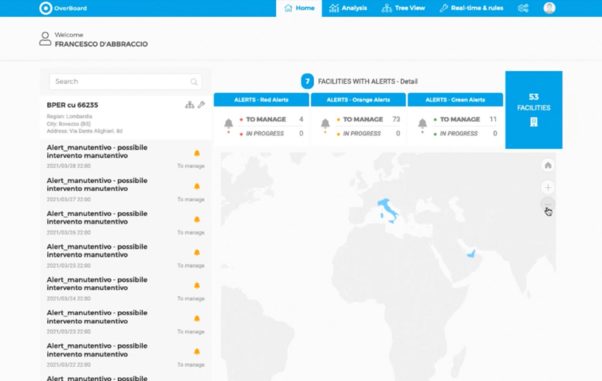
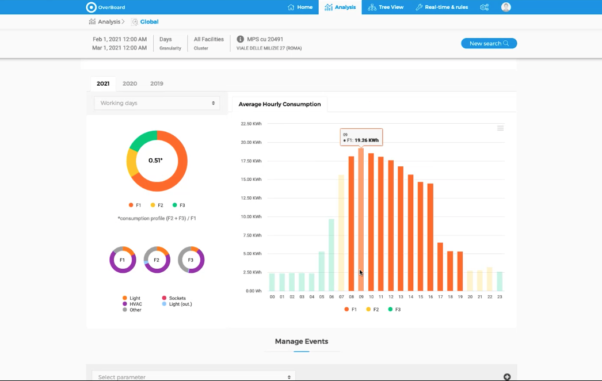
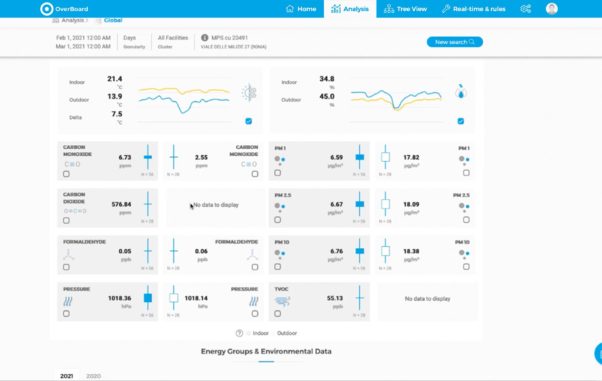
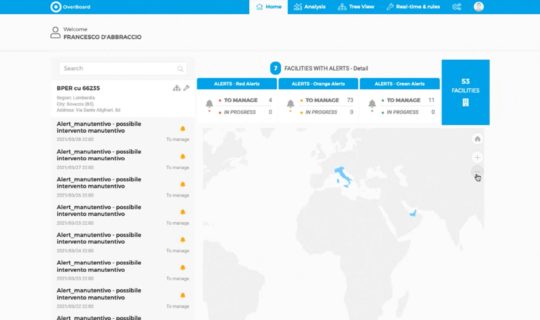
On the OverBoard platform you can perform a complete analysis on the entire network of plants connected to the OVER system. It is possible to check systems on a macro or ‘global’ level or choose customizable KPI for individual or “clustered” properties. Data can be viewed by month, day, hour and filtered according to customized or pre-set timeslot filters (last full month, last full year) as is preferred.
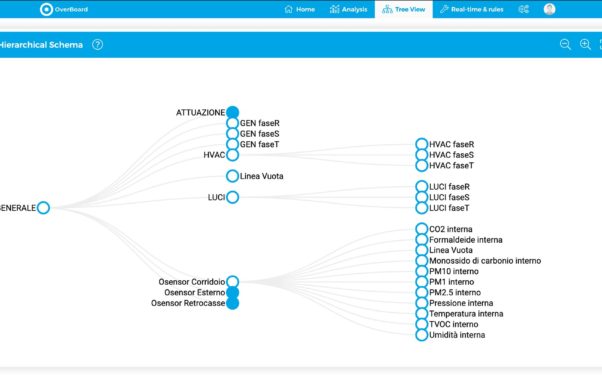
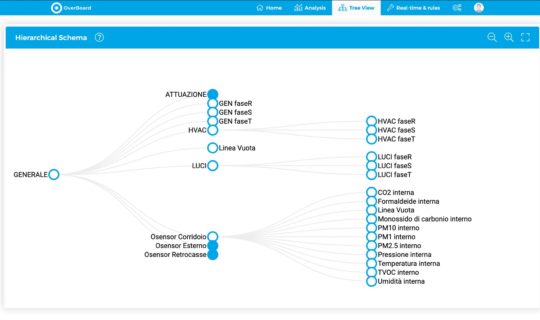
The TREE VIEW section shows a hierarchical diagram of the entire plant and the monitored lines. This allows each user to monitor individual devices and individual power lines, and as well as to create custom graphs including or not including lines of interest.
Define which KPIs are relevant for your company, group related properties into KPI clusters for multi-site analysis and reports on best and worst performers, alert history, and general energy data.
Resources
Get a copy of the manual
Download it below